The Ice Sheet model SICOPOLIS
Recently, I started working with SICOPOLIS, a three-dimensional dynamic/thermodynamic ice sheet model. Download and usage are fairly easy. As long as you want to use the predefined experiments. Although setting up an alternative configuration is not complicated, using you own forcing data is. Nevertheless, the code is well written, the output format is standard netCDF which can be easily processed with—guess what—python and matplotlib.
Here is one example.
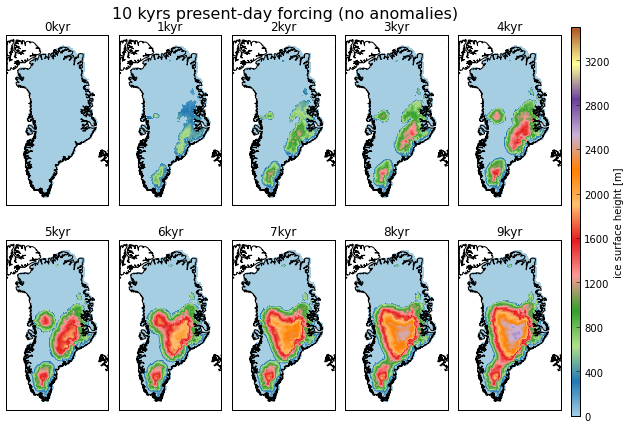
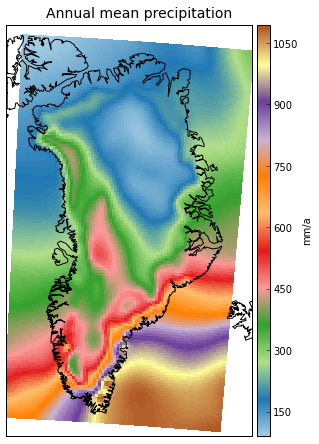
Initially, Greenland has no land ice. Under current boundary conditions, i.e. present-day surface temperature and precipitation rates, the ice sheet starts to grow (left figure). After nine thousand years, large parts of southern and central Greenland are ice-covered, mainly because of the large snowfall compared to northern Greenland (right figure).
And I’m amazed. Not because of the results, they seem straightforward. I’m amazed because of the time scales tackled here. Within minutes (literally!), an evolution of a whole ice sheet, which would take many thousands of years, is at my feet. And now I’m becoming aware of the work that lies ahead of me.
In the past 12 months, I was working more or less on the climatology of atmospheric fields like air pressure, air temperature and various radiative heat fluxes. But this was just tens of years. Here, we are talking about time scales 2–3 orders of magnitude larger than this. What an eye-opener. The real question I need to answer is:
How does the seasonal melt cycle affect the large-scale evolution of the Greenland Ice Sheet?